
Data-Backed Racing Analysis
UK Horse Race Winner — Data-Backed Analysis and Results
Best Horse Racing Betting Sites – Bet on Horse Racing in 2026
No picks. No hype. Just data-backed analysis.
What Makes a UK Horse Race Winner
A horse crosses the finish line first. Simple enough on the surface — until you consider everything that had to align for that moment to happen. The breeding decisions made three years prior. The trainer's choice of race. The ground beneath the hooves. The jockey's calculation of pace through the final furlong. British horse racing generates a total economic contribution of £4.1 billion annually, and every pound of that ecosystem ultimately orbits around a single question: which horse wins?
This is not a tipster page. You will not find a list of today's best bets or a promise that some algorithm has cracked the code. What you will find is a data-backed analysis of UK horse race winners — the structures, statistics, and conditions that separate the runners who hit the frame from the ones who trail home behind them. British racecourses attracted nearly 4.8 million spectators in 2024, drawn by a sport that blends elite athletics with genuine unpredictability. The appeal is understandable. So is the frustration of trying to make sense of it all.
The pages ahead break the sport into its component parts. We start with the raw scale of the industry before moving into the mechanics of how winners are officially determined — a process that goes well beyond first past the post. From there, form guides, going conditions, the major races that define the calendar, and a systematic approach to evaluating contenders. We also look at the numbers behind the horse population itself, because the supply side of this sport is shifting in ways that affect every race card. And where the data warrants it, we address welfare — not as a footnote, but as a dimension of the sport that shapes regulations, public perception, and the very races that get run.
Think of this as a field guide written by someone who reads the Racing Post and the Equine Veterinary Journal in the same sitting. The tone is analytical, the sources are primary, and the goal is to make you sharper about what actually produces a UK horse race winner.
British Racing by the Numbers: What Shapes Every Winner
- UK horse racing contributes £4.1 billion annually to the economy and attracted over 5 million spectators in 2025 — but the horse population is declining at roughly 1.5–2.3% per year, with the BHA projecting 6–7% fewer starts by 2027.
- Market favourites win 30–35% of races; odds-on favourites on the flat reach 55–60%. The top three in the betting account for 65–70% of all winners — the market is your strongest single signal, but far from infallible.
- Going conditions explain over 80% of the variation in race performance according to academic research. Checking the going before studying form is the simplest high-impact filter available.
- Total prize money reached £188 million in 2024, with racecourse contributions exceeding £100 million for the first time. The financial health of the sport directly influences race quality and field sizes.
- Welfare reforms, including padded hurdles that reduce falling risk by 11%, are reshaping race conditions — and understanding these changes is part of understanding modern results.
The Scale of UK Horse Racing in Numbers
Horse racing likes to call itself the second-largest spectator sport in Britain. That claim gets tossed around without much supporting evidence on most websites, so let us be specific about what the numbers actually show.
The industry generates direct revenue exceeding £1.47 billion per year. When you factor in the induced economic effects — the hotels near Cheltenham, the transport networks ferrying racegoers to Ascot, the betting shops on every high street — the total contribution reaches £4.1 billion, according to figures the British Horseracing Authority submitted during the Gambling Act review. That figure encompasses roughly 85,000 jobs, more than 20,000 of which are directly tied to BHA-licensed racecourses. From stable staff in Lambourn to catering teams at Doncaster, the workforce behind racing is larger than many people assume.
£4.1 billion — total annual economic contribution of UK horse racing, including direct revenue and induced effects.
85,000 jobs — estimated employment across the industry, with 20,000+ on licensed racecourses.
£188 million — total prize money distributed across British racing in 2024, a 2% increase year-on-year.
Prize money tells its own story. In 2024, the total prize fund across British racing reached £188,032,620 — a 2% increase on the previous year. More notable is where that money came from: racecourse executive contributions crossed the £100 million mark for the first time (£100,673,329), accounting for 54% of the total fund. That shift matters because it signals racecourses investing more of their own commercial revenue back into the sport, rather than relying primarily on owners and the Horserace Betting Levy.
"Horseracing is unique amongst major sports in that we attract customers looking for elite sport and a fantastic social occasion," said David Armstrong, Chief Executive of the Racecourse Association. The attendance figures back that up. British racecourses recorded 5,031,640 visitors across 2025, a 4.8% rise that pushed total attendance above the five million threshold for the first time since before the pandemic. That is not a sport in spectator decline — it is one that draws crowds even as broader leisure habits fragment.
The financial architecture of the sport is complex, layering owner investment, bookmaker levies, media rights, and racecourse hospitality revenue into a system where the health of one part depends on all the others functioning. Understanding this ecosystem is not just background reading — it directly informs why certain races are scheduled when they are, why prize money varies so dramatically from a Monday at Wolverhampton to a Saturday at Newbury, and why the quality of the horse population is as much an economic question as a sporting one.
How Winners Are Determined: Rules, Photo Finishes, and Stewards
The basic rule is deceptively simple: the first horse's nose to cross the finish line wins. Not the head, not the neck — the nose. In a sport measured by margins of a short head or a nostril, that anatomical precision matters enormously. But the journey from crossing the line to being confirmed as the official winner involves several layers of verification that casual viewers rarely consider.
Official winning margins in British racing: A short head is the smallest winning distance recorded. The scale ascends through head, neck, half a length, and upward. Distances are estimated by the judge, except when a photo finish is called — which happens more often than you might expect.
The photo finish camera has been a fixture of British racing since the late 1940s. Positioned precisely on the finish line, it captures a continuous strip image as horses pass. The resulting photograph compresses the crossing into a single frame, allowing the judge to determine not just who finished first, but the exact margin of victory. Modern systems produce digital images within seconds, though the formal announcement still waits for the judge's confirmation. In tight finishes, that pause between the horses crossing and the announcement can feel like an age — and for punters, it often is.
Crossing first does not always guarantee victory. The stewards' enquiry process can alter the result after the race. If a horse has interfered with a rival during the running — drifting across the track, impeding another horse's progress, or causing a jockey to check — the stewards have the authority to demote the offending horse in the final placings. The severity depends on whether the interference materially affected the result. A horse that wins by ten lengths and drifts marginally in the closing stages is unlikely to lose the race in the stewards' room. A horse that wins by a neck after carrying a rival across the track almost certainly will.
Jockeys themselves can also trigger an objection, formally protesting the result within a narrow window after the race. The stewards then review camera angles and patrol footage before making a ruling. It is worth noting that objections and enquiries are not interchangeable terms: an objection comes from a participant, while an enquiry is initiated by the stewards themselves. Both can result in placings being revised.
Disqualification for non-riding reasons adds another dimension. If a horse tests positive for a prohibited substance during post-race testing, it can be disqualified weeks or even months after the race. The BHA operates a rigorous testing programme, and the consequences range from disqualification to fines and suspensions for the trainer. From a betting perspective, most bookmakers pay out on the official result at the time of settlement — a subsequent disqualification does not typically reopen settled bets, though rules vary by operator and jurisdiction.
Then there is the matter of dead heats. When the judge cannot separate two horses even with the photo finish technology, the race is declared a dead heat. Prize money is divided equally, and bets are settled at half the original stake at full odds. Dead heats are rare but not vanishingly so — they occur a handful of times each season and invariably cause confusion among less experienced punters who assume there must always be a single winner.
Understanding this process matters because the official result is the only result that counts. The horse that "looked like it won" on television is irrelevant if the stewards see otherwise. Form guides record the official result, bookmakers settle on the official result, and the historical record of a horse's career is built on official results. Everything downstream — from form analysis to trainer statistics — depends on the integrity of this determination process.
Reading a Form Guide: The Foundation of Winner Selection
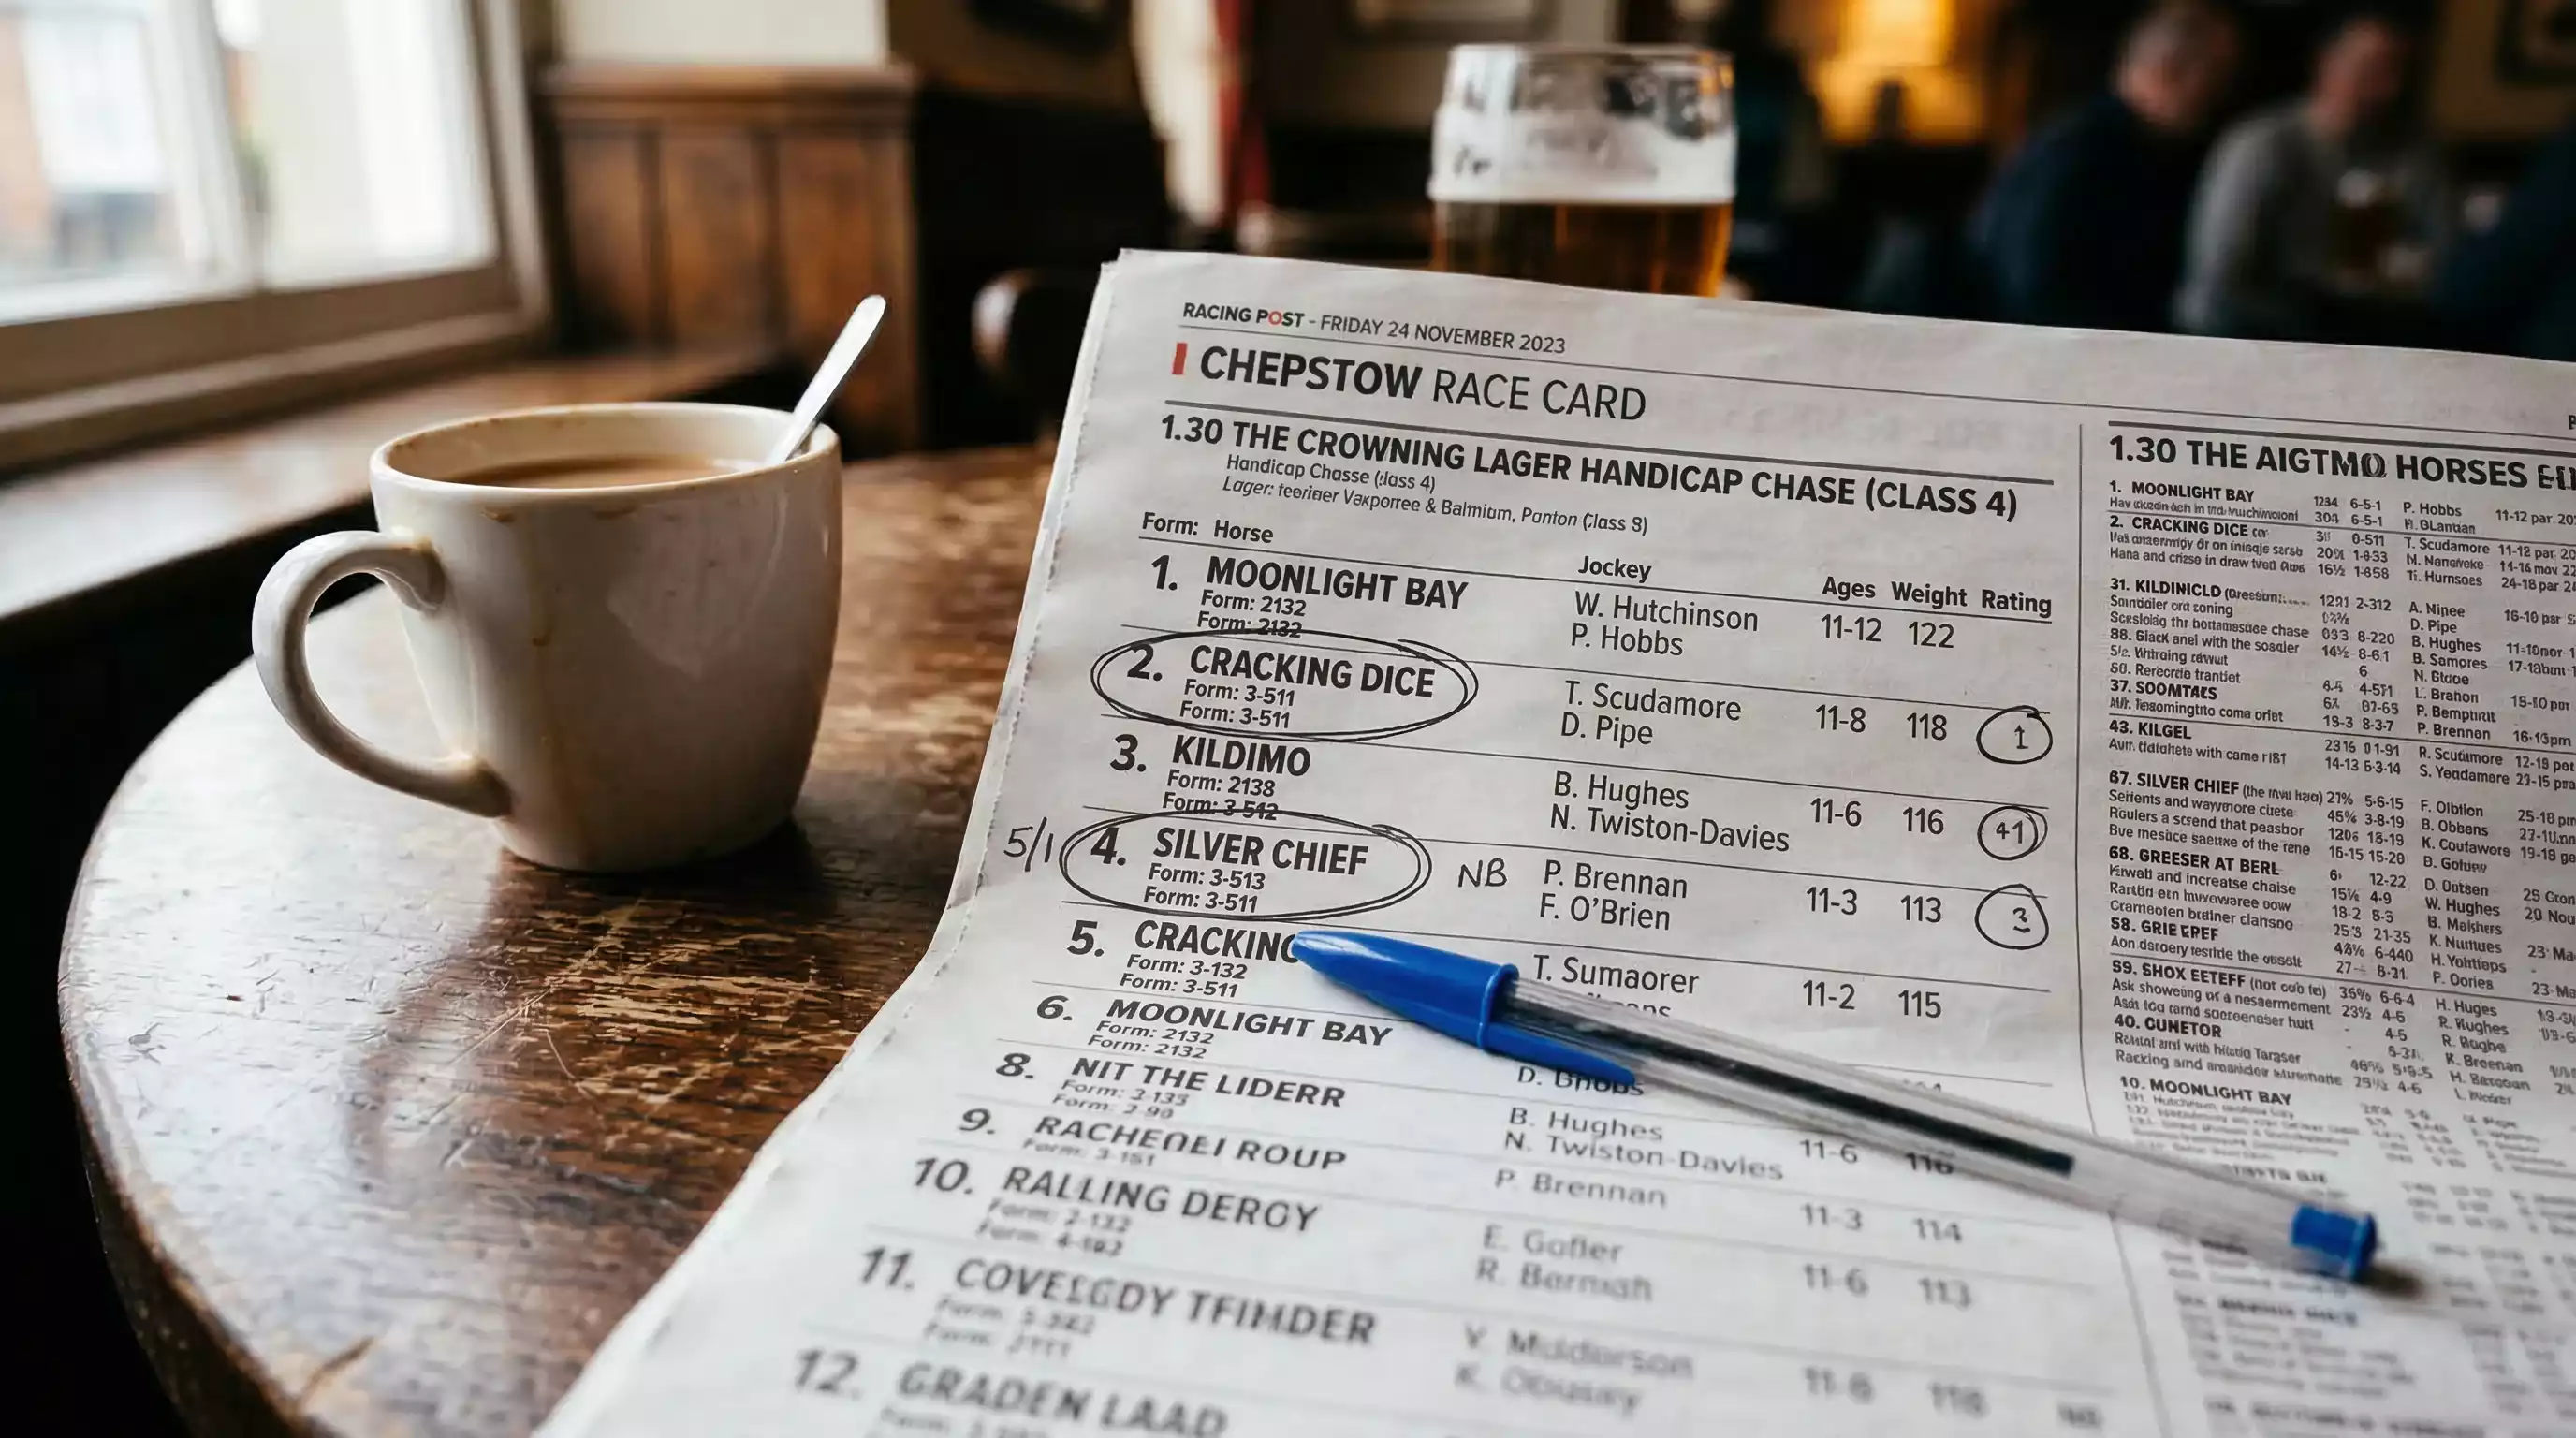
Every serious assessment of a horse's chances starts with the form guide. It is the sport's equivalent of a financial statement — a compressed record of past performance that tells you where a horse has been and, if you read it carefully, offers clues about where it might be heading. The challenge is that form guides pack an extraordinary amount of information into a dense format that can overwhelm newcomers and even trip up experienced racegoers.
What a form guide contains: At minimum, a standard UK form entry includes the horse's name, age, weight carried, recent finishing positions (form figures), Official Rating, the trainer, the jockey, draw position, and going preferences. More detailed guides add Racing Post Ratings, speed figures, days since last run, and course-and-distance records.
Form figures are the first thing most people scan. A sequence like 1221-3 tells you the horse finished third in its most recent start (the rightmost figure), with the dash before it indicating a break between seasons, while prior to that break it won, then finished second twice, then won again in its earliest recorded run. The most recent run appears on the right of the sequence, the oldest on the left. Simple enough in isolation, but the real skill lies in contextualising those numbers. A horse that finished third in a Group 1 at Ascot is demonstrably more impressive than one that won a seller at Catterick, yet both might display a "3" and a "1" in their form strings.
This is where ratings enter the picture. The Official Rating (OR) is assigned by the BHA handicapper and reflects the horse's assessed ability based on its race performances. A higher OR means a better horse — in theory. In practice, handicap ratings compress the field, so a horse rated 95 carrying 9st 7lb faces roughly the same task as a horse rated 75 carrying 8st 0lb. The Racing Post Rating (RPR) offers an independent assessment that sometimes diverges from the OR, and speed figures attempt to measure raw performance against the clock, adjusted for going conditions and course configuration.
Favourite win rates: Market favourites win approximately 30–35% of British races. Second favourites win 18–21% of the time, and the top three in the betting market collectively account for 65–70% of all winners.
Those favourite statistics are worth absorbing. They tell you that the collective wisdom of the betting market — informed by form, connections, track conditions, and money — gets it right roughly a third of the time for the top pick. That is a meaningful edge over random selection in a field of ten, but it also means the favourite loses two out of every three races. The form guide is the tool that helps you decide whether a particular favourite deserves your confidence or whether the second or third in the market has been overlooked.
Going preference is another critical column. A horse that has won three of its four starts on soft ground and finished last on firm is telling you something unambiguous about its requirements. Cross-referencing a horse's going record with the conditions on the day is one of the simplest and most effective filters available — yet it is routinely ignored by casual punters who fixate on recent finishing positions without considering the surface beneath.
Odds-on favourites on the flat: According to Matchbook Insights analysis, odds-on favourites in flat turf racing win 55–60% of the time. In maiden races, that figure rises to 61%. At odds of 1.25 or shorter, the win rate climbs to 86%.
The form guide does not predict the future. What it does is reduce uncertainty by establishing a baseline of information about every runner. The punter who reads a form guide properly is not guessing — they are making an informed assessment grounded in evidence. The punter who ignores it is hoping. In horse racing, hope is an expensive strategy.
Going Conditions and Their Measurable Effect on Results
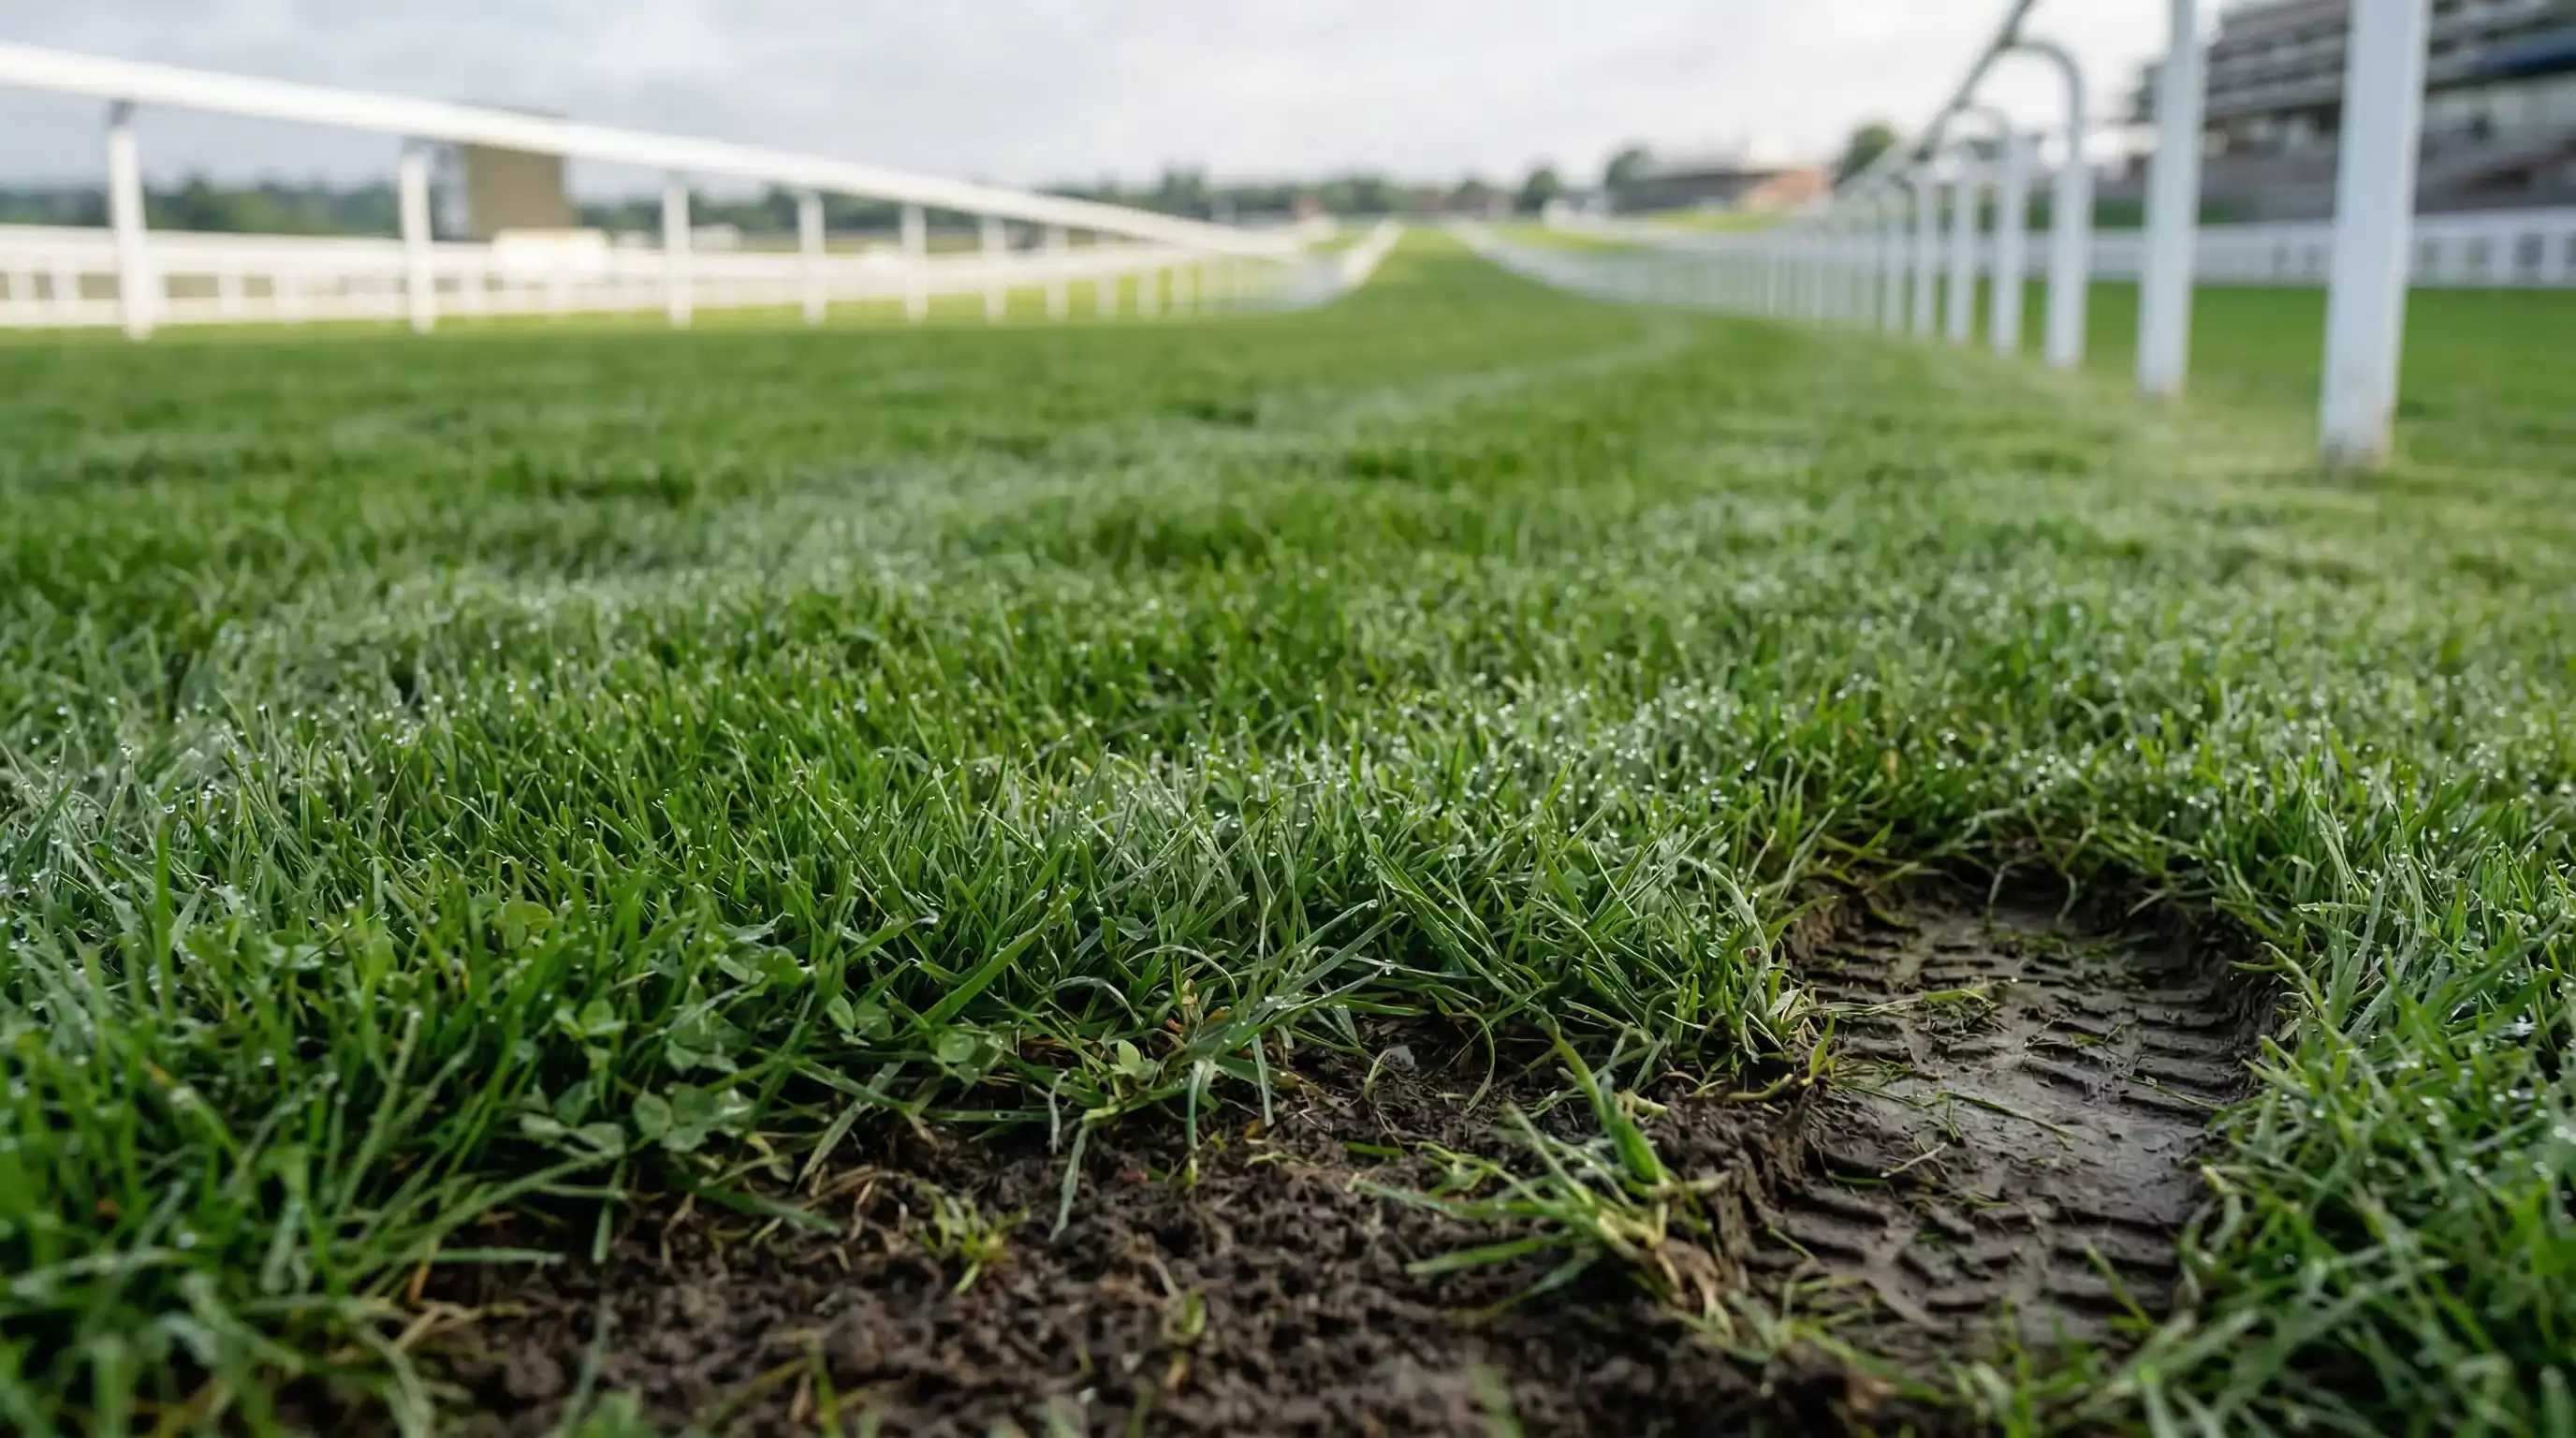
If there is a single factor that separates knowledgeable racegoers from casual ones, it is the attention paid to going conditions. The ground beneath a racehorse's hooves is not a neutral surface — it is an active variable that amplifies some horses' strengths and exposes others' weaknesses. And unlike form or class, the going can change between the time declarations are made and the moment the stalls open.
The official going scale in Britain runs from Hard (the firmest) through Firm, Good to Firm, Good, Good to Soft, Soft, and Heavy (the most rain-saturated). Clerks of the course assess the ground and update the going description, often multiple times on a raceday. Analysis of UK racing data from 2016 to 2024, covering over 6,200 races, reveals that 71–85% of races are run on some variant of Good ground (Good to Firm, Good, or Good to Soft). Soft and Heavy conditions account for 13–24% of races, while truly firm or fast ground represents just 3–9%. That distribution matters: horses that only perform on extreme ground face far fewer opportunities than those that handle the Good spectrum.
Going distribution in UK racing (2016–2024): Good conditions (Good to Firm / Good / Good to Soft) prevail in 71–85% of races. Soft or Heavy ground features in 13–24%. Hard or Firm ground occurs in only 3–9% of fixtures.
For decades, going assessments relied on the clerk's experience — walking the course, prodding the turf with a stick, and using judgement refined over years. The GoingStick, introduced in the 2000s, brought a degree of standardisation by measuring both penetration and shear resistance of the surface. But even with this tool, going descriptions remain somewhat subjective. A course described as Good to Soft at Cheltenham may ride differently from Good to Soft at Newbury, because soil composition, drainage, and microclimate all vary between venues.
Recent academic research has pushed understanding significantly further. A 2024 study by Hobbs and colleagues at the University of Central Lancashire and Nottingham Trent University measured racecourse surfaces using a novel impact device that quantifies "cushioning" — essentially, the force the ground exerts on a horse's hoof at impact. Their findings were striking: cushioning alone explained 81.9% of the variation in performance going (adjusted r² = 0.819). They identified a threshold at approximately 10 kilonewtons — roughly twice a horse's body weight — beyond which firmer ground no longer translated to faster times. The horses simply reached a speed ceiling.
"To the best of my knowledge, this is the first time that quantitative analysis of properly contextualised race times has appeared in an academic paper as an independent means for validating the nature of the racing surface," said Simon Rowlands, a respected racing analyst, commenting on the research. Mark Lucey, a retired veterinarian and equine surface specialist, added: "This may help in reducing injuries and improving horse welfare by quantifying ground impact forces."
The UCLan/NTU research matters for punters because it provides a scientific framework for something form students have long observed intuitively: that the going is not merely descriptive but predictive. A horse that excels on Good to Firm may not improve further on Firm because the ground has already reached the cushioning threshold where speed plateaus. Conversely, when ground softens beyond that threshold, the energy cost of running increases substantially — favouring stamina-laden types over pure speed horses.
For practical purposes, checking the going should be the first thing any racegoer does before studying form. Cross-reference the declared going with each horse's performance on similar conditions, and you immediately filter out runners who are likely to underperform. The going changes. Your assessment should change with it. In the spring of 2026, with the National Hunt season winding down and the Flat turf season returning, the transition from winter soft to spring good makes this filter especially dynamic — and especially valuable.
The Races That Define British Racing
Not all races are created equal. British racing runs approximately 1,400 fixtures a year across 59 racecourses, but a handful of events carry disproportionate weight — in prize money, prestige, and the sheer volume of public attention they attract. These are the races that shape the narrative of each season, produce the names remembered decades later, and generate the moments that draw people into the sport in the first place.
The Cheltenham Festival in March stands as the undisputed championship of National Hunt racing. Four days, twenty-eight races, and a concentration of quality jump horses that no other meeting can match. The Champion Hurdle, the Queen Mother Champion Chase, the Stayers' Hurdle, and the Cheltenham Gold Cup form the spine of the programme, each testing a different dimension of jumping ability. For punters, the Festival offers some of the most formful — and most competitive — races on the calendar, with large fields and a form book that rewards careful analysis over hunches.
The Grand National at Aintree in April occupies a different space entirely. It is the race that Britain talks about even if it talks about no other. The course — roughly four miles and two and a half furlongs over thirty fences — attracts the largest television audience of any racing event in the country and generates more once-a-year betting activity than any other single race. Up to thirty-four runners (reduced from forty in 2024 for safety reasons), a complex handicap, and the unique demands of the Aintree fences make it exceptionally difficult to predict — which, of course, is precisely its appeal. In recent years, safety reforms have been significant: the BHA has committed to replacing all traditional birch hurdles with padded alternatives — shown by RVC modelling to reduce the risk of falling by 11% — across British racing by October 2026.
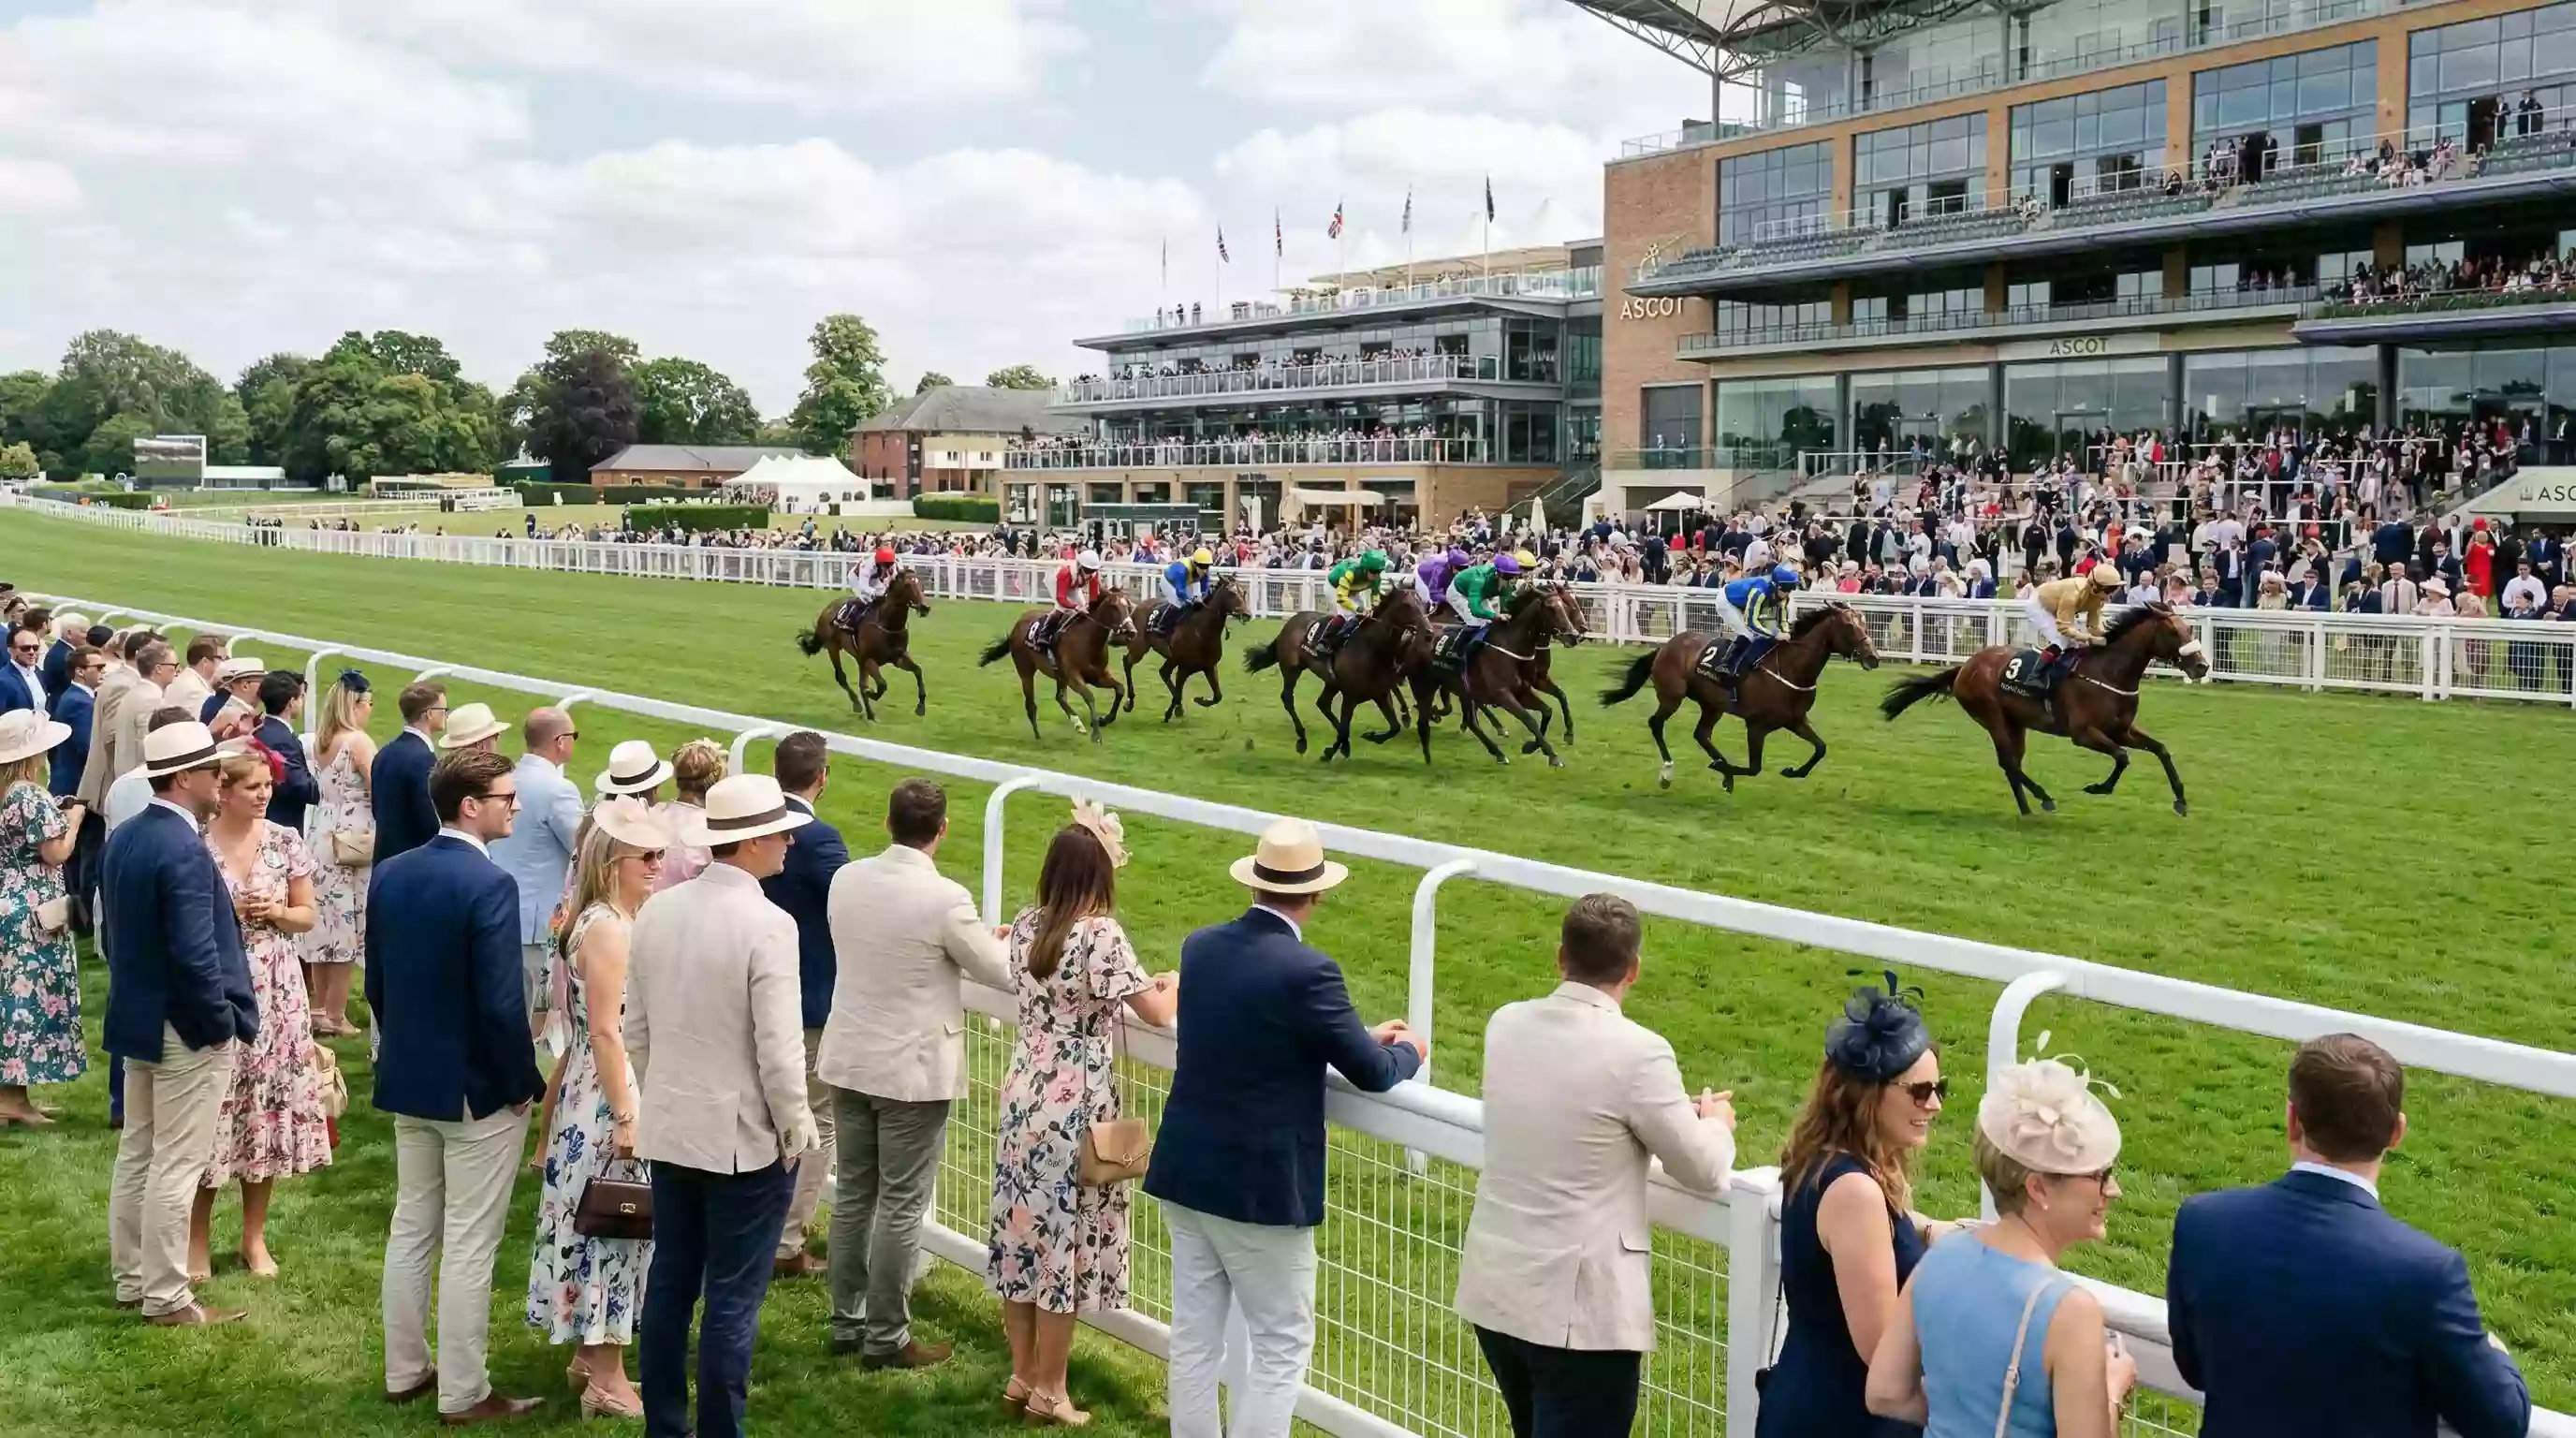
Royal Ascot in June brings flat racing to its showcase. Five days of top-class action, a strict dress code in the Royal Enclosure, and a race programme that includes Group 1 contests at every distance from five furlongs to two and a half miles. Racecourse attendance data for the first half of 2025 showed a 5.1% year-on-year increase, and Royal Ascot's contribution to that figure was substantial. It is, in every sense, the sport at its most visible.
| Event | Code | Month | Feature Race | Typical Field Size |
|---|---|---|---|---|
| Cheltenham Festival | National Hunt | March | Gold Cup | 12–16 |
| Grand National | National Hunt | April | Grand National | 34 (maximum) |
| Guineas Festival | Flat | May | 2000 / 1000 Guineas | 10–18 |
| Epsom Derby | Flat | June | Derby / Oaks | 10–16 |
| Royal Ascot | Flat | June | Gold Cup / Queen Anne | 8–20+ |
| Glorious Goodwood | Flat | July–August | Goodwood Cup / Nassau | 8–16 |
| Ebor Festival, York | Flat | August | Juddmonte International | 8–12 |
| St Leger, Doncaster | Flat | September | St Leger | 8–12 |
The five Classics — the 2000 Guineas, 1000 Guineas, Oaks, Derby, and St Leger — form the traditional backbone of the flat season. The Epsom Derby remains the most coveted prize for three-year-old middle-distance horses, its unique camber and undulations producing a test that no training gallop can fully replicate. The St Leger at Doncaster, the oldest Classic, extends the trip to a mile and three-quarters and often separates the genuine stayers from horses that merely tolerate a distance.
Beyond the headline events, the supporting cast of festivals at Goodwood, York, Newbury, and Aintree's own flat fixtures provides consistent high-quality racing through the summer and autumn. Total prize money across British racing hit £188 million in 2024, and that pool is distributed across more than 1,400 completed fixtures — but the major festivals command a share far exceeding their proportion of the calendar. Nearly 4.8 million spectators passed through racecourse turnstiles in 2024, with a significant concentration at the flagship meetings. The races that define the sport do so because they combine the best horses, the highest stakes, and the largest audiences into events that matter beyond the racing bubble.
A Data-Driven Approach to Picking Winners
There is no system that reliably picks horse race winners. Anyone who claims otherwise is selling something. What does exist is a process — a structured way of evaluating the available data that reduces the field of probabilities and helps you make decisions grounded in evidence rather than instinct. The distinction between a system and a process matters: a system promises outcomes, while a process improves the quality of your reasoning. In a sport where the favourite loses two-thirds of the time, improved reasoning is the only genuine edge available to the public.
The starting point is form. Not just recent form, but contextualised form. A horse that finished fourth in its last three starts looks mediocre until you discover those races were all Group 2 contests at Newmarket, and the horse it faces today is coming off a win in a Class 4 at Kempton. The finishing position means nothing without understanding the level of competition. Form figures are a compass, not a map — they point a direction, but you need to read the terrain yourself.
Class is the next filter. British racing is organised into a hierarchy from Group 1 at the top through Group 2, Group 3, Listed, and then the Class system (1 through 7 for handicaps and conditions races). A horse dropping in class is, statistically, more likely to be competitive than one stepping up. This is not always true — some horses improve dramatically and justify a rise — but class drops are one of the most reliable positive indicators in the sport. Look at the Official Rating and where the horse has been running recently relative to today's race.
Going conditions, as discussed in the previous section, act as a further screen. Draw bias is the companion variable that too few people consider. On certain courses — particularly those with straight tracks like Beverley, Chester's tight left-handed loop, or Goodwood's quirky undulations — the stall position can materially influence the outcome. A horse drawn widest in a large field on a straight five-furlong course faces a measurably different task from one drawn near the rail. The impact varies by distance, field size, and going, but ignoring it entirely is an analytical blind spot.
Trainer and jockey form adds a human layer. Some trainers target specific races with precision — a horse trained by a handler who has a 25% strike rate at Cheltenham in November is a different proposition from one whose yard is in a slump. Jockey bookings can signal intent: a trainer switching to a top jockey for a particular race often means the horse is expected to run well. Average field sizes at Premier Flat Racedays in 2024 rose to 10.86 runners, up from 10.50 the previous year — meaning competitive racing with more runners to separate, which makes connections' intent harder to read but more valuable when identified.
The market as baseline: With favourites winning roughly a third of all races and odds-on shots reaching 55–60% on the flat, the betting market provides the strongest single predictor of outcomes — but bookmaker margins ensure that blind obedience to market signals produces a long-term loss.
What do these numbers mean in practice? The market is your best single indicator of likely outcomes, but it is far from infallible. Blindly backing every favourite produces a long-term loss because bookmaker margins ensure that 30–35% wins at the prevailing prices do not cover the 65–70% of losses. The value — if it exists — lies in identifying the races where the favourite's price understates its actual probability, or where a horse lower in the betting has been overlooked by the market.
The process, distilled: read the form in context, filter by class, check the going, note the draw, assess the connections, then compare your analysis against the market. Where your assessment and the market diverge, you have either found value or made an error. Knowing which is which takes experience, record-keeping, and a willingness to be wrong more often than you are right. The goal is not to pick every winner — it is to make better selections than the person who backs the horse with the best name.
A useful exercise before any race is to rank the field by form merit, then re-rank by going suitability, then overlay the market prices. Horses that appear in your top four on both your lists but sit outside the top three in the betting market deserve closer examination. They will not always win. But over a sustained period, the disciplined application of this process produces results that gut feeling alone cannot match.
Horse Population, Breeding, and the State of the Sport
The quality of any horse race depends fundamentally on the quality and quantity of the horses that contest it. On this front, British racing faces a structural challenge that the attendance figures and prize money headlines do not immediately reveal: the horse population is shrinking, and the trajectory has been downward for several years.
According to the BHA's 2025 Racing Report, the number of horses in training in Great Britain stood at 21,728 — a decline of 2.3% from the previous year. This is not a sudden dip. The contraction has been persistent, with approximately 1.5% year-on-year reductions since 2022. The total number of individual horses that actually ran in a race during 2024 was 18,452, down 1% from 18,630 in 2023. The split between the two codes is telling: Flat racing saw a modest 0.5% increase in runners, while National Hunt suffered a 3% drop.
21,728 — horses in training in Great Britain as of the BHA's 2025 report, a 2.3% decline year-on-year and part of a multi-year downward trend.
The breeding pipeline offers little reassurance. The British foal crop — the number of thoroughbred foals born in Great Britain for racing purposes — fell from 4,510 in 2023 to 4,198 in 2024, then to 4,015 in 2025. That represents a decline of more than 10% in two years. Fewer foals born today means fewer horses entering training in two to three years, which translates to smaller field sizes, fewer competitive races, and a diminished product for racegoers and punters alike.
At the top end of the jump racing spectrum, the picture is sharper still. The number of high-class jump horses rated 130 or above by the BHA dropped from 787 in 2023 to 716 in 2024 — a 9% reduction in a single year. Lose enough horses at that level and the championship races that define the Cheltenham Festival and other Grade 1 events become less competitive, less watchable, and less attractive to bettors seeking form reliability.
The BHA itself projects that the number of race starts in Britain will be 6–7% lower by 2027 compared to 2024 levels. That is not an alarmist prediction from outside observers — it is the governing body's own modelling, published in its official Racing Report.
The BHA's 2025 Racing Report acknowledged the environmental dimension of these challenges. The report noted that changing weather patterns will mean periods of more extreme conditions are likely to become the norm, requiring the industry to adjust the way it operates. Abandoned meetings, waterlogged tracks, and heat-related concerns during summer all compound the supply-side pressures already created by a declining horse population.
Why does this matter for understanding UK horse race winners? Because field sizes, race quality, and the competitive depth of a card directly affect how form translates into results. A twelve-runner handicap with a strong spread of talent is a fundamentally different proposition from an eight-runner race where two horses are clearly outclassed. As the horse population contracts, the character of the sport's betting markets shifts — and the analytical frameworks used to identify winners must adjust accordingly.
Welfare and Safety: What the Data Shows
Any honest assessment of horse racing must engage with the question of equine welfare. It is not a peripheral issue or a topic to be glossed over with vague assurances. The data on injuries and fatalities in British racing is publicly available, increasingly detailed, and worth examining directly.
The overall fatality rate across all British racing — Flat and National Hunt combined — stood at 0.22% of all runners in 2025: 192 fatal injuries from 86,300 starts. That aggregate figure, however, conceals significant variation between the codes. In jump racing specifically, the rate was 0.47% (133 from 28,116 starts), while flat turf racing recorded a considerably lower 0.10%. The difference is intuitive — jumping over obstacles introduces a level of risk that flat racing does not — but the magnitude of that difference is important for anyone assessing the sport honestly.
Fatality rates by code (2025): All racing — 0.22%. Jump racing — 0.47%. Flat turf — 0.10%. Jump racing carries approximately four to five times the fatality risk of flat turf racing.

Academic research has sharpened the picture further. A peer-reviewed study by Allen and colleagues at the Royal Veterinary College, published in the Equine Veterinary Journal, analysed fatality data from 2010 to 2023 and found that steeplechase races carried a rate of 5.9 fatalities per 1,000 starts (836 cases from 141,922 starts), while hurdle races recorded 4.5 per 1,000 starts (1,096 from 242,486 starts). Falls account for a substantial portion of these outcomes: BHA data indicates that 38% of all fatalities in jump racing are directly associated with a horse falling during the race.
Professor Kristien Verheyen, Professor of Veterinary Clinical Epidemiology at the Royal Veterinary College, has led much of this research. She has emphasised that the work is conducted collaboratively with the industry, stating that the research will help the industry make scientifically backed decisions that benefit the welfare of equine participants, which she described as the number one priority for everyone involved in racing.
The industry's response has centred on data-driven interventions. The most tangible example is the transition to padded hurdles. Modelling by the RVC demonstrated that One-Fit Padded Hurdles reduce the risk of a horse falling by 11% compared to traditional birch hurdles. British racing has committed to replacing all conventional birch hurdles with padded alternatives by October 2026 — a deadline that is now months away. Risk models developed by the RVC also identify specific risk factors at the level of individual race conditions, enabling clerks of the course and race planners to make more informed decisions about fence placement, ground management, and race scheduling.
None of this is to minimise the risks. Horses die racing in Britain every year, and any claim that the sport is entirely safe would be dishonest. What the data does show is a sustained effort to quantify risk, identify causal factors, and implement evidence-based reforms. Whether that is sufficient is a judgment that extends beyond statistics into ethics and personal values — a question we revisit in the conclusion. For the purpose of understanding how winners emerge, welfare measures matter because they shape race conditions: fence types, ground management standards, field size limits, and veterinary oversight all influence which horses run, where, and under what constraints.
Frequently Asked Questions
How do I read a horse racing form guide?
A form guide compresses a horse's racing history into a standardised format. Start with the form figures on the right of the entry — these show recent finishing positions, with the most recent run listed last. A "1" means a win, "0" means finished outside the first nine, and letters like "P" (pulled up), "F" (fell), or "U" (unseated rider) indicate incomplete runs. Next, check the Official Rating (OR) for an indication of ability, the going preference to see which ground conditions suit the horse, and the trainer and jockey combination. Cross-reference recent form with the class of races the horse has been competing in — a sixth-place finish in a Group race may represent stronger form than a win in a low-grade handicap. The key skill is contextualisation: form figures alone tell you very little without knowing the conditions under which they were produced.
What does "going" mean in horse racing and how does it affect results?
Going describes the condition of the racing surface, ranging from Hard (driest and firmest) through Firm, Good to Firm, Good, Good to Soft, Soft, and Heavy (most waterlogged). In British racing, the majority of races — roughly 71–85% — take place on some variant of Good ground. Going matters because different horses perform vastly differently depending on the surface. A horse bred for stamina on soft ground may struggle on firm going, and vice versa. Academic research has shown that the "cushioning" of the ground — the force it exerts on impact — explains over 80% of the variation in race times at different going levels. Always check the going before studying form, and cross-reference each horse's record on similar conditions. It is one of the simplest and most effective filters for narrowing a field.
How to pick a winner in horse racing — is there a system?
There is no guaranteed system, but there is a structured process that improves your chances of making informed selections. Start with form — look at recent results in the context of race class, not just finishing positions. Then filter by going suitability and, where relevant, draw bias at the specific course. Assess the trainer and jockey combination, noting any changes that might signal intent. Compare your analysis against the betting market: horses you rate highly that the market has at longer odds deserve close attention. Market favourites win roughly 30–35% of the time, which means a process that identifies when a favourite is overbet or when a longer-priced horse is undervalued can produce better outcomes than following the crowd. Keep records, review your reasoning, and treat it as a skill to develop rather than a code to crack.
Where the Data Points Next
The picture that emerges from the data is of a sport in a state of productive tension. Attendance is up. Prize money is growing. Racecourse investment has crossed new thresholds. Yet the horse population is declining, the foal crop is shrinking, and the BHA's own projections anticipate fewer race starts by 2027. These are not contradictions — they are the dynamics of an industry evolving under economic, environmental, and ethical pressures simultaneously.
Public perception adds another dimension. A survey conducted by researchers at the University of York found that 48.3% of respondents agreed or strongly agreed that horse racing is too unethical for them to participate in, while 45.5% said greater transparency would increase their likelihood of attending. Those numbers sit in an uncomfortable balance — nearly half the public is deterred, but nearly the same proportion would reconsider with more openness. The industry's response to that finding, through welfare data publication, risk modelling, and safety reforms, will shape the next decade of the sport as much as any training programme or breeding decision.
For the purposes of data-backed analysis of UK horse race winners, the takeaway is clear: the sport rewards those who engage with its complexity rather than looking for shortcuts. Form guides, going conditions, class structures, race selection, connections, and welfare regulations all feed into the outcomes of any given race. The punter who understands these inputs — and tracks how they are changing — operates with a significant informational advantage over one who simply scans the morning's tip columns.
The races will keep running. The variables that produce winners will keep shifting. The data, for those willing to read it, keeps getting richer. That is, perhaps, the most encouraging trend of all.